Speaker Placement and Acoustic Environment Effects
on Nearfield Monitor Systems –
MIX Magazine
To Woof Or Not To Woof? A SUBstantial Question – MIX Magazine
Optimizing the Studio Listening Environment – MIX Magazine
Acoustic Solutions, The RPG B.A.S.S. Trap – MIX Magazine
Examining the Yamaha NS-10M “Tissue Paper
Phenomenon” –
Recording Engineer/Producer Magazine
Sound Advice 1 – Modern Home Theater
Sound Advice 2 – Modern Home Theater
Sound Advice 3 – Modern Home Theater
Sound Advice 4 – Modern Home Theater
Sound Advice 5 – Modern Home Theater
Sound Advice 6 – Modern Home Theater
Sound Advice 7 – Modern Home Theater
Educational Resources
Articles written either for MIX
Magazine or Recording Engineer/
Producer Magazine or Modern
Home Theater.
– by Bob Hodas
Gain insights into studio listening environments and rooms.
Examining the Yamaha NS-10M “Tissue Paper Phenomenon”
An Analysis of the Industry-Wide Practice of Using a
Tissue-Paper Layer to Reduce High-Frequency Output
Recording Engineer/Producer Magazine, February 1986 – by Bob Hodas
In the past couple of years, the Yamaha NS-10M loudspeaker has become the alternative small control-room monitor. One rarely enters a studio or views a control-room photo in the trades, without seeing a pair of NS-10Ms sitting on top of the console for use as a close-field reference. I have even been in several recording situations where this monitor was the only small reference speaker available, and I was told that my well-known brand of "mini-monitors" were no longer required by most mixing engineers. This being the fact nowadays, there is no reason here to trace the history of why the NS-10M became so popular so quickly. Instead, this article is concerned with the even stranger phenomenon that has followed the rise in popularity of the NS-10M - the use of tissue paper to cover the tweeters, thus reducing the high-frequency radiation.
As I can best determine, this phenomenon began on the East Coast with an engineer that was having a string of hits, and who spoke of his NS-10M monitoring technique in a number of different interviews. Other engineers then zeroed in on the technique, hoping that it would give them the secret for producing hits. And so the legend grew. This is not merely a practice restricted to the U.S., as one can observe the same occurrence in foreign studios and publications.
The stimulus for writing about this phenomenon finally came when the following interesting story was told to me. It seems that a young engineer walked into the manager's office of a New York studio, and said that he was very unhappy with the monitoring situation. The engineer was using the studio's NS-10Ms, but complained that they had the "wrong" type of tissue paper covering the tweeters.
Well, not wanting to appear ignorant of the latest technology, nor to risk being shunned by my peers and R-e/p readers, I decided to run comparative tests on different brands and varieties of tissue, paper towels and toilet paper. I went to the grocery store and bought about $30 worth of the above items, borrowed a pair of NS-10Ms from a studio, and proceeded with the tests.
Comparative Test Procedure
To ensure that the best results would be obtained, I decided to use the test facilities at Meyer Sound Labs, Berkeley, CA. Test equipment included a B&K Model 4133 half-inch free-field microphone, B&K Model 2619 pre-amp, Hewlett-Packard Model 3561A analyzer, and an Ashley FET-500 amplifier to power the NS-10M speakers. (For those interested, a complete procedural description of the measurement technique can be found in the October 1984 AES reprint 2150 (I-8), "Equalization Using Voice and Music as the Source," by John Meyer.)
The test included first measuring the speaker in a two-pi position, and then in a position that would simulate their being located on top of a console. Every 20 or 30 minutes during the tests, the reference was recalled to check for fluctuations due to temperature or humidity variations, and was reset if more than a half-dB change appeared. Although only one speaker was used in the tests, we checked the pair to look for inconsistencies. The two speakers measured very similarly; in fact, the NS-10M demonstrates a very linear frequency response with respect to signal level.
![]() Enlarge View
Enlarge View
of Fig. 1
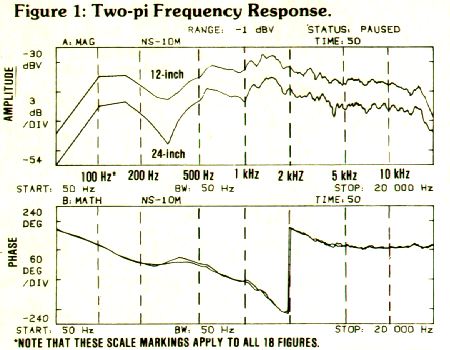
Figure 1 shows the two-pi frequency versus amplitude and phase response. The amplitude (top trace) holds pretty close to +/- 3 dB, and remains quite consistent whether measured at a distance of 12 inches (upper curve) or 24 inches (lower curve). The phase response (bottom trace) is also consistent with respect to level, but notice that between 500 Hz and 4 kHz, there is an excess delay indicating a lack of coherency. This anomaly could be caused by the NS10's crossover circuit, which centers at 2 kHz.
![]() Enlarge View
Enlarge View
of Fig. 2
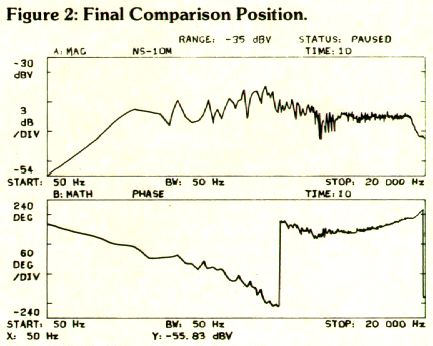
Figure 2 shows the measurement taken at a distance of 24 inches using the final comparison position, simulating a top-of-console location. The curve is almost identical to Figure 1 from 900 Hz and up, but below that point things have changed. While the hole between 180 and 400 Hz has smoothed out nicely, the 500 Hz to 1 kHz region is a bit more erratic, and the bass rolloff begins at 180 Hz instead of 50 Hz. This effect was attributed to the plane of the console bridge being in line with the speaker.
![]() Enlarge View
Enlarge View
of Fig. 3
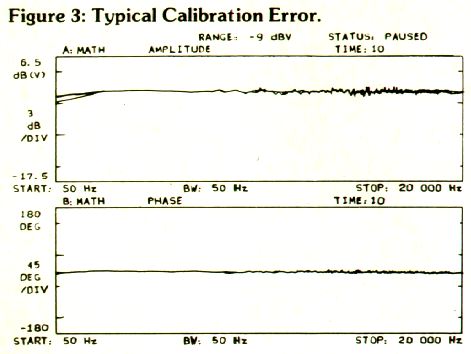
The amplitude and phase curves shown in Figure 2 were stored in the analyzer, and became a reference (essentially a straight line) for any change that would occur. Figure 3 demonstrates the calibration error that can be expected in these measurements; from the three overlays it may be noted that any deviation is typically less than 0.5 dB. It is very important to note that the remainder of the charts are not pure frequency response, but curves showing only the deviation from the reference caused by the addition of a tissue layer.
The test samples came from three different groups of facial tissue (ten samples), toilet paper (six samples), and paper towels (three samples). Within each group, there were variations of brand, ply number and color, and the samples were measured in single- and double-layer formations. Since facial tissue seems to be the main choice for engineers, this was the first group to be examined.

![]() Enlarge View
Enlarge View
of Fig. 4
Figure 4 is a good representation of what happens to the frequency response when a layer of tissue is placed over the tweeter. The HF rolloff effect begins at around 3 kHz, and drops as much as 3 dB before returning to the reference level at about 11 kHz. Then another dip of about 2.5 dB occurs with a center frequency of about 16 kHz. As we shall see, this curve was fairly typical throughout the test, with amplitude variations being the primary difference. Notice that the phase response exhibits only minor fluctuations, with center frequencies being a bit lower. Tissues that exhibited such response anomalies were two-ply/one-layer versions of Kleenex Pocket Pack Facial Tissue (yellow), Gingham Facial Tissue (white), Nice 'n' Soft Unscented Tissue (white), and Coronet Facial Tissue New Unscented (white).
![]() Enlarge View
Enlarge View
of Fig. 5
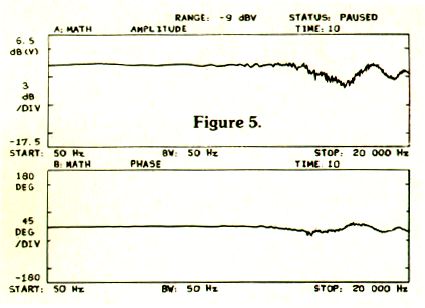
Figure 5 demonstrates a smoother curve, exhibited by two samples of a single layer of two-ply represented by Kleenex Pocket Pack Facial Tissue (pink and blue). It is interesting to note that the white version of this same tissue - whose response is shown in Figure 6 - exhibited dips 1 to 2 dBs deeper than those detailed above.
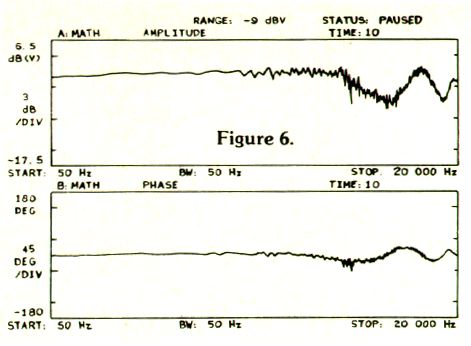
![]() Enlarge View
Enlarge View
of Fig. 6
![]() Enlarge View
Enlarge View
of Fig. 7
![]() Enlarge View
Enlarge View
of Fig. 8
![]() Enlarge View
Enlarge View
of Fig. 9
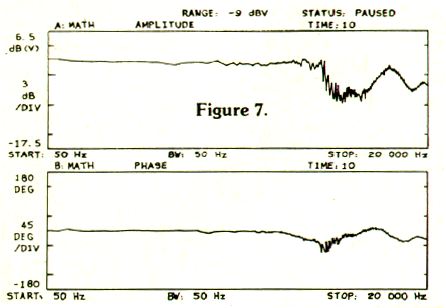
Now we'll look at the effect of folding the tissue to form two layers of two-ply covering the tweeter. As one would expect, there is a significant drop in level although, as you will observe, the affected frequencies remain roughly the same. Figure 7 demonstrates the sample group with a 1 dB drop at 11 kHz, and then a more severe high-end rolloff than the one-layer samples. There is also a deeper, wider dip from 3 to 10 kHz. Samples in this group were Kleenex Pocket Pack Facial Tissue (blue, yellow and pink), and Coronet Facial Tissue New Unscented (white).
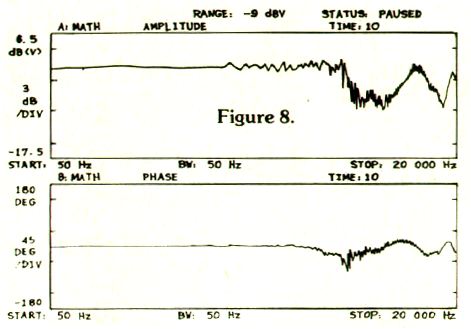
Figure 8 demonstrates a more extreme effect. While the 11 kHz region is hardly affected, the two dips have become more severe. Gingham Facial Tissue (white) and Nice 'n' Soft Facial Tissue Unscented (white) fit into this sample. The real surprise in this sample was that two of the one-layer brands exhibited this same curve: Kleenex Facial Tissue (white), and Kleenex Softique Lightly Scented (yellow).
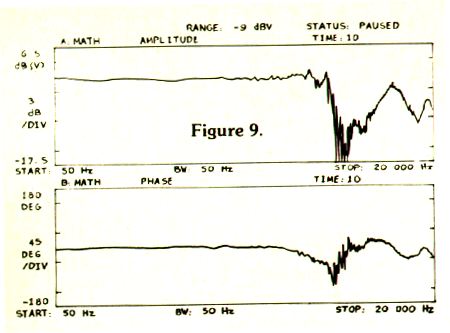
Figure 9 shows the most extreme effect in the two-layer tests. As can be seen, the rolloff is extremely non-linear, and the dips are quite deep with these samples. Represented here are Kleenex Softique Lightly Scented (yellow), and Kleenex Facial Tissue (white). The effect is not surprising in reference to these two tissue's performances as single layers in Figure 8. Somewhat mellower - but still extreme - were Kleenex Boutique Facial Tissue (blue) and Kleenex Pocket Pack (white).
From these results I found it difficult to draw generalized conclusions based on brand, model or color, and so proceeded to measure the toilet paper samples to see what that might uncover. The T.P. samples grouped themselves into four categories, and we will look at them in order of the degree of effect they had on the reference.
![]() Enlarge View
Enlarge View
of Fig. 10
![]() Enlarge View
Enlarge View
of Fig. 11
![]() Enlarge View
Enlarge View
of Fig. 12
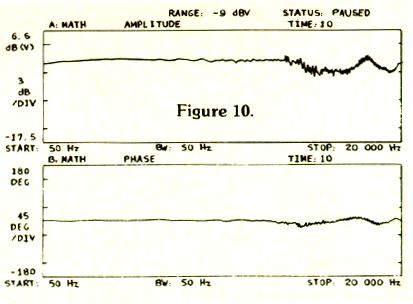
Figure 10 represents the first group, and one will notice immediately that the effect is less than that produced by any of the tissue groups. I would have to attribute the difference to the fact that these were all one-ply paper, while tissue is always two-ply. Included in this group were Charmin New Stronger Than Ever (yellow and blue), and Family Scott (white).
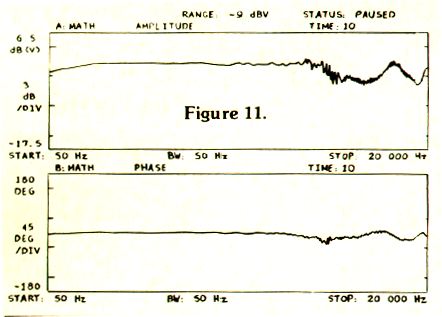
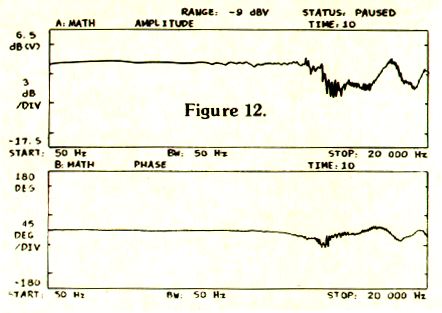
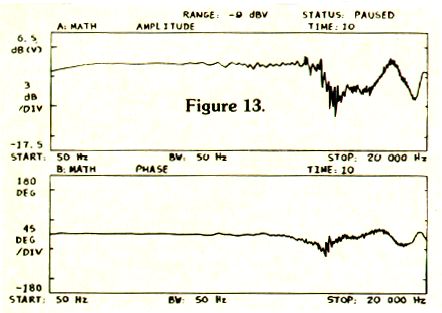
Figure 11 demonstrates that even two-ply T.P. does not approach the 3 to 10 kHz drop caused by tissue, yet is just as effective at the dip above 11 kHz. T.P. in this group was Northern Quilted (yellow), MD Unscented (white), and - a big shocker - Scottissue one-ply (white). As some of you may already know, this latter brand is a hefty one-ply, and the result most likely due to its beefier construction.Figures 12 and 13 show the effect of using T.P. in a two-layer configuration, and these samples more closely resemble curves that one would expect from tissue paper; they exhibit the wide 3-dB holes from 3 to 10 kHz, and the deep dip after 11 kHz. Figure 12 is represented by one-ply papers: Scottissue (white), Family Scott (patterned), and Charmin New Stronger Than Ever (blue and yellow). Figure 13 is represented by two-ply papers, illustrating only Northern (yellow), and MD Unscented (white).
![]() Enlarge View
Enlarge View
of Fig. 13
![]() Enlarge View
Enlarge View
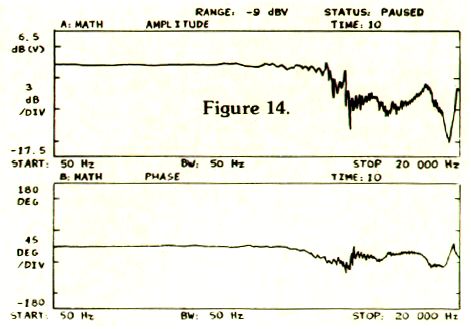
of Fig. 14
I almost didn't measure the effect of paper towels, because no one has ever mentioned using them. But, for the sake of science, I decided to explore new, uncharted territory. Every tested paper towel exhibited a different curve, showing no consistency for drawing conclusions. One very interesting thing was found, however: Brawney two-ply in a two-layer configuration exhibited the smoothest rolloff of any test sample, as can be seen from Figure 14.
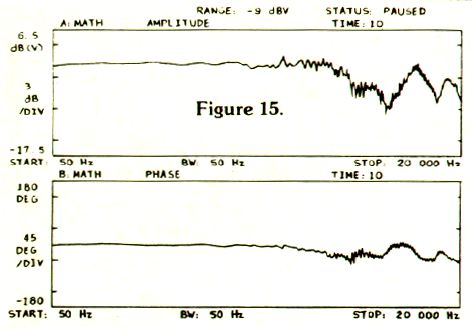
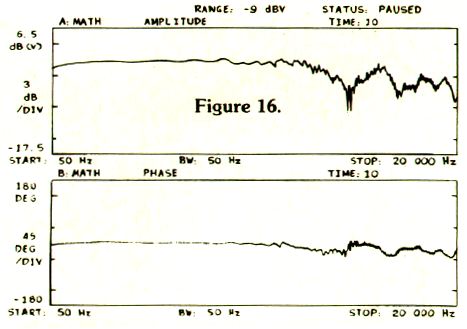
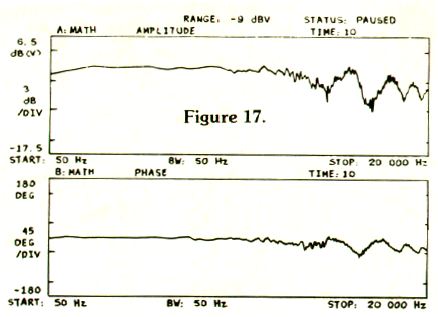
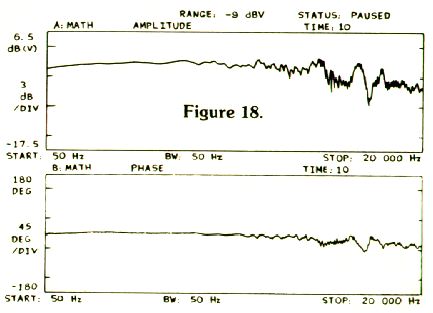
So what conclusions can we draw at this point? We can rule out color as a factor in the measurements, but cannot definitely state that two layers will cause much deeper frequency response dips than the same tissue or paper in a single layer (Figure 8). We can see that, at times, two layers of T.P. can simulate tissue curves, but cannot draw positive conclusions about the effect of ply number (Figure 11). At this point I was generally unhappy at not being able to draw more precise patterns from this experiment, and so I took another approach. Thinking that I may get a more accurate measurement of high-frequency absorption, I placed the tissue over the microphone. Imagine my surprise when the chart came out looking exactly like Figure 3, and exhibited absolutely no deviation from the reference. This discovery led to the idea of hanging a sheet of two-ply Kleenex in front of the tweeter at distances of 0.5, 1, 1.5, and 2 inches; the results of these tests are depicted in Figures 15 thru 18, respectively. Interesting, dont you think?
![]() Enlarge View
Enlarge View
of Fig. 15
![]() Enlarge View
Enlarge View
of Fig. 16
![]() Enlarge View
Enlarge View
of Fig. 17
![]() Enlarge View
Enlarge View
of Fig. 18
So now we have something concrete: Kleenex did not absorb any high frequencies when placed over the microphone capsule, while Figures 15 thru 18 indicate that the HF attenuation affect of tissue is position dependent. As a result, it would appear that the tissue creates the one thing that studio designers around the world try to avoid, fearing it most in their control rooms: Comb Filtering. The paper filters are not absorbing the high frequencies, but simply reflecting them back into the tweeter, thereby causing cancellation through comb filtering.
Since nobody would put up with such aberrant behavior in their main control-room monitors, why should we go this route in a close-field speaker? The result is a very crude and, I would say, undesirable method for dealing with the problem of a speaker sounding a bit too bright. And, as one can see from the charts included in this article, the use of tissue layers is certainly a very uncontrollable and non-linear method of doing the job. If a little less high-end is desired, how about a simple electronic filter that could be measured and controlled in a more reliable manner than the "Tissue Fix?"